MASW and Resistivity Sounding
Pasco County, Florida / MASW, ReMi, ERI
Our client was coordinating the conversion of an oil-burning power plant to natural gas. As part of the associated geotechnical study, GeoView, Inc. was tasked with determining the S-wave velocity and vertical resistivity structure at the site. For the seismic portion of the study, MASW (Multi-channel Analysis of Surface Waves) and ReMi (Refraction Microtremor) methods were utilized. Challenges for the project included multiple sources of subsurface and above-ground interference and the fact that the study needed to be conducted while the plant was in operation
MASW data acquisition was accomplished using a Geometrics Geode, 48-channel digital seismograph with an array of low-frequency geophones (4.5 Hertz) spaced at 5-ft intervals.
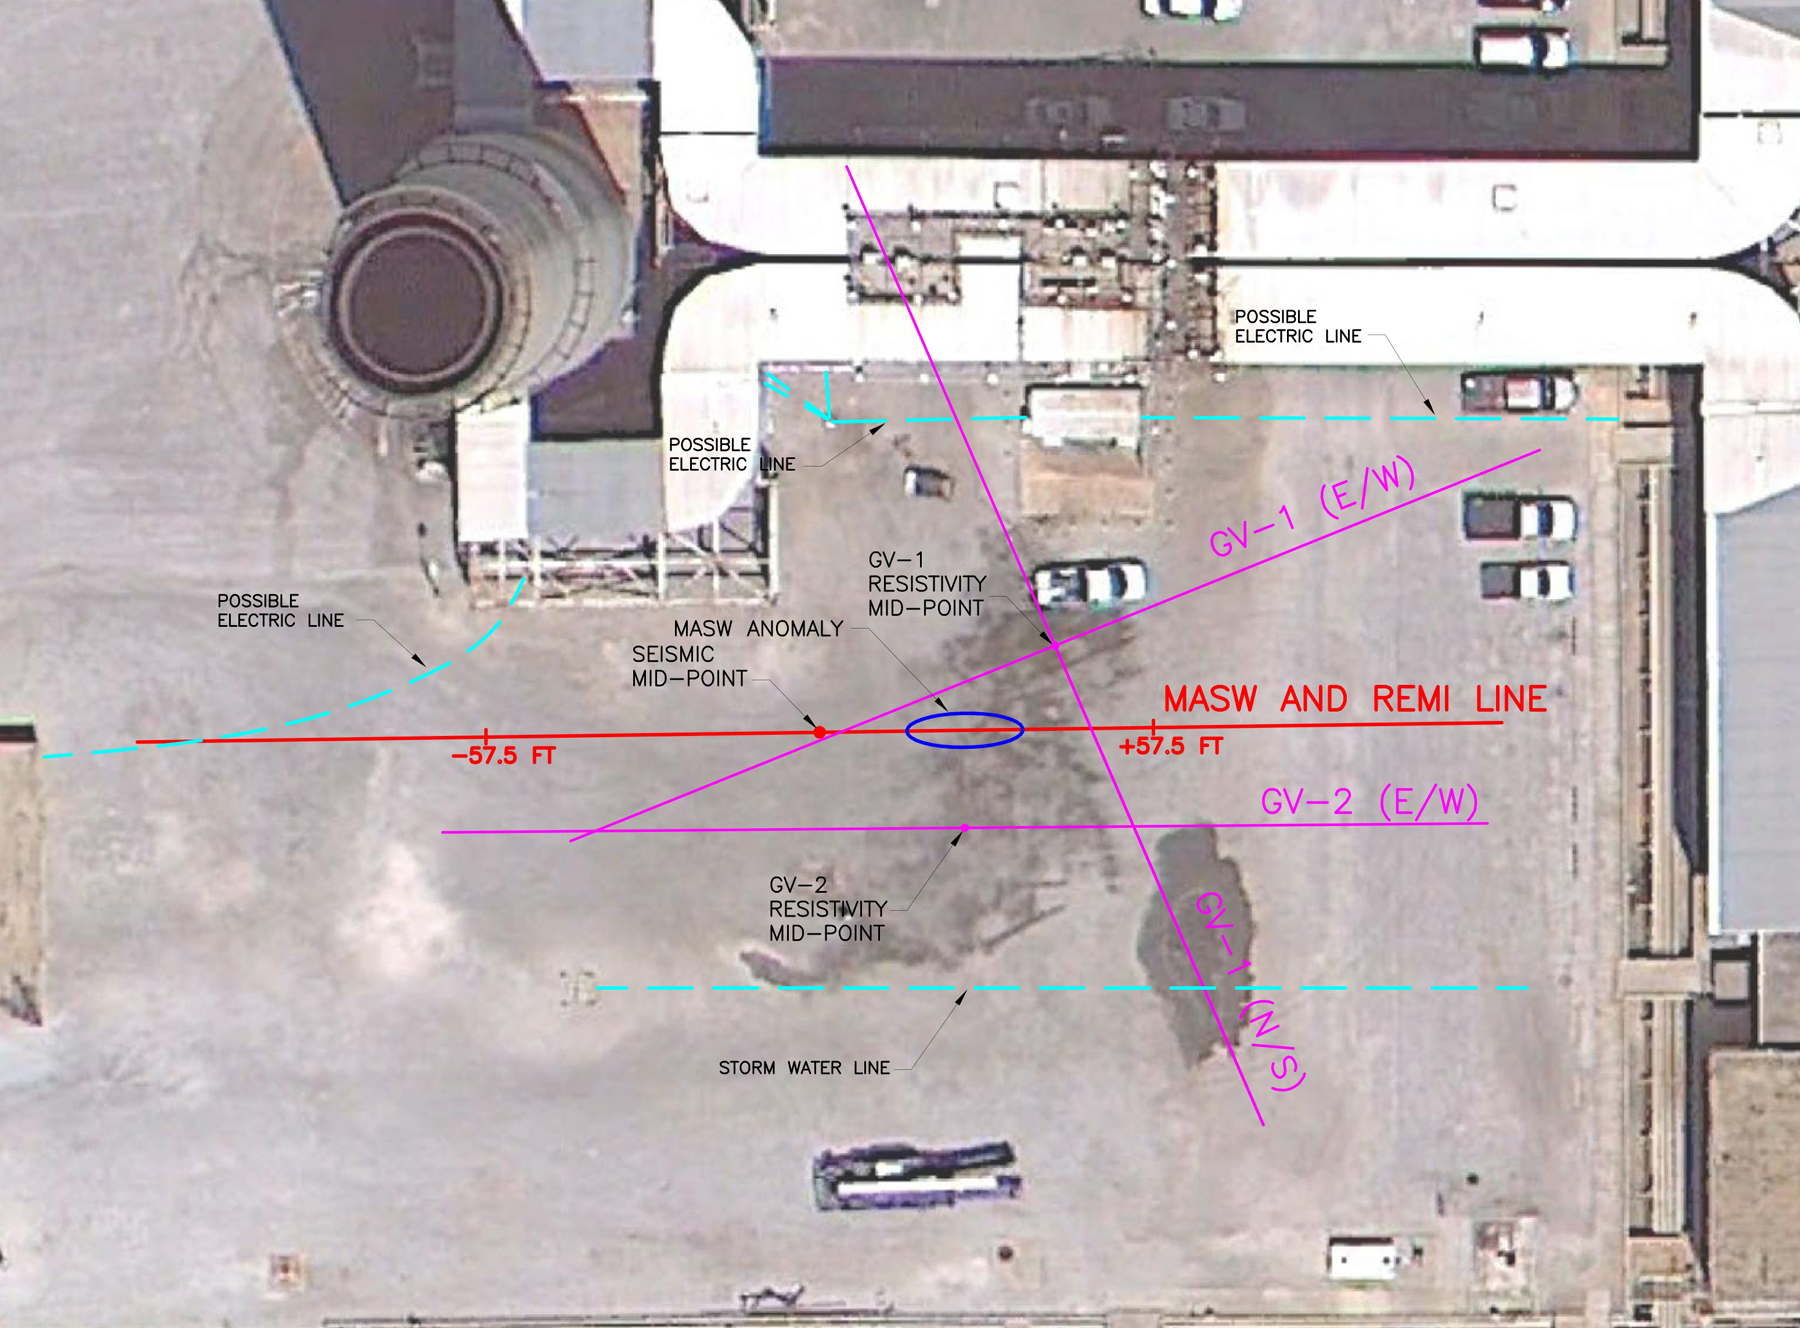
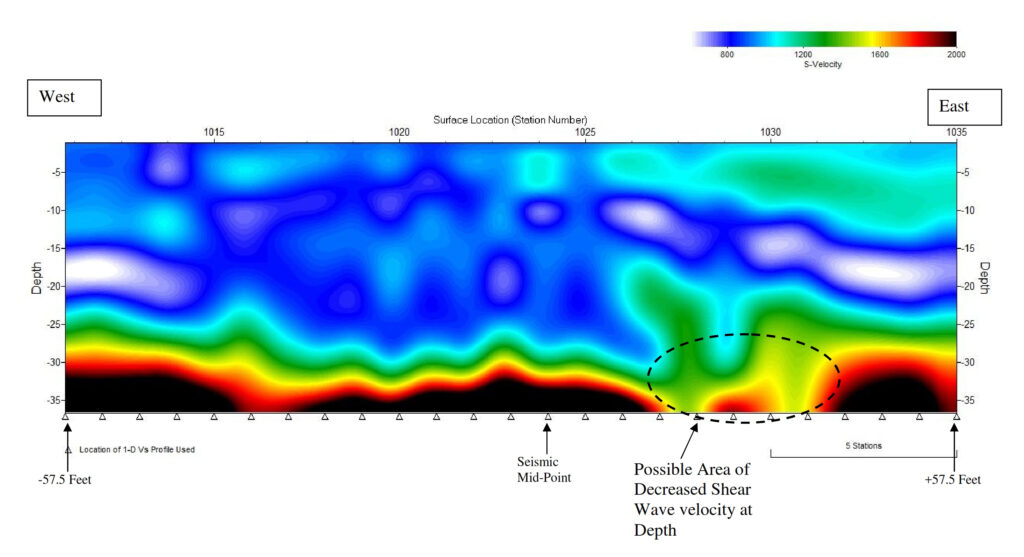
Twenty-four of the geophones were used for each shot point and advanced in increments with the shot point advances. An 18-lb sledge hammer striking a polyethylene plate (shot point) was used to generate surface waves. It was necessary to drill holes in the asphalt to allow for placement of the geophone spikes. The MASW data was analyzed using Surfseis. The site area is known for the presence of buried paleo-karst (sinkhole) features. A suspect feature was identified in the eastern portion of the MASW transect.
ReMi data was collected using the same seismic system. Both passive and active sources were used to collect the ReMi data. The same active source that was used for the MASW study was used for the ReMI study. The passive sources consisted of noise from the power plant located east of the seismic line and vibrations from passing vehicles and a helicopter. The ReMi data was analyzed using SeisOpt ReMi software. The program was used to calculate a one-dimension vertical shear wave velocity structure. An additional MASW test was also performed using same the center of the 24 geophones used in the REMI study to create a comparison one-dimension vertical shear wave velocity structure.
With the ReMi results it was possible to calculate a well-resolved shear wave velocity profile to a depth 100 ft below land surface. The results show significant increases in shear wave velocity at depths of 20, 44 and 83 ft.
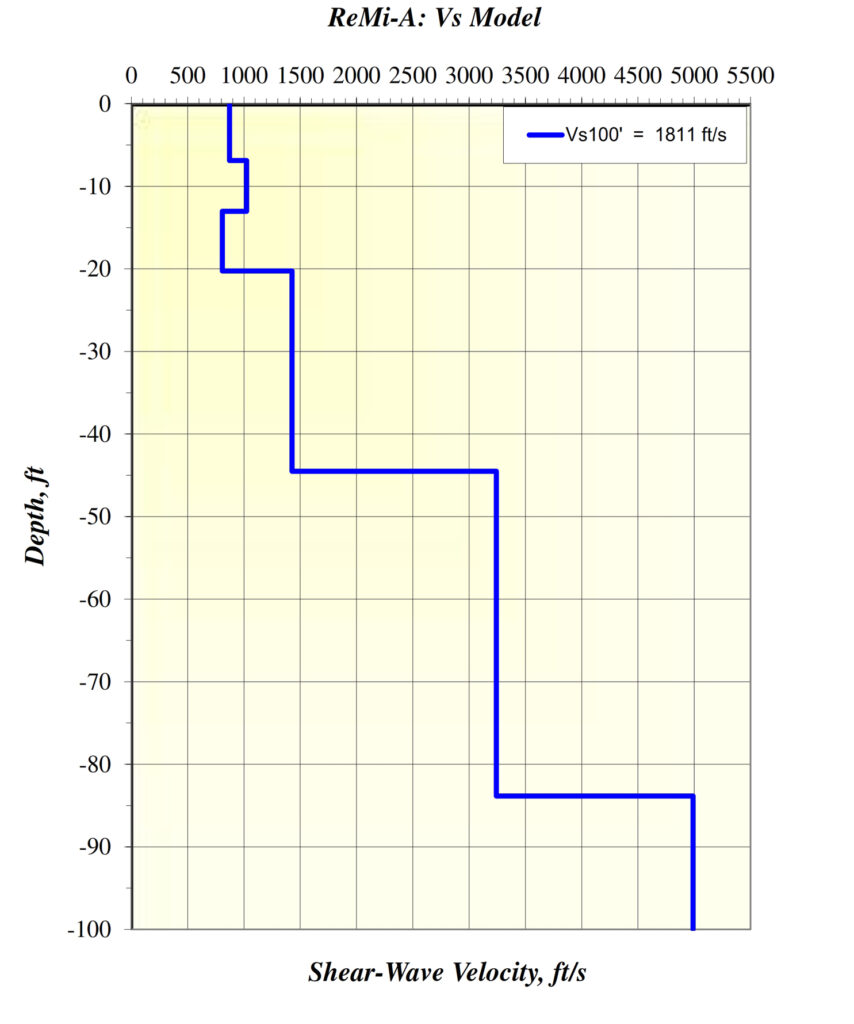
The calculated average shear wave velocity of the upper 100 ft was 1,811 ft/second. The MASW data provided a well-resolved shear wave velocity profile to a depth 33 ft below land surface. The results show significant increases in shear wave velocity at depths of 21 and 27 ft bls. Because of the shorter survey length for the MASW profile in comparison to the REMI profile, the MASW data was able to identify smaller velocity transitions within the near-surface soils. However, velocity estimates were similar within the common depth ranges.
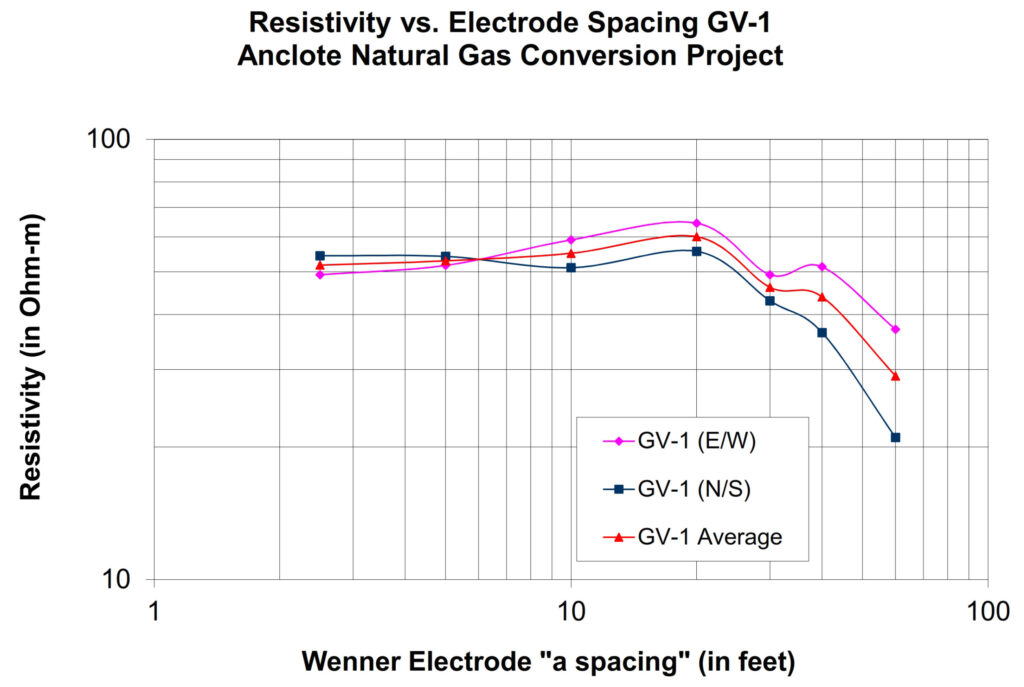
The four-pin resistivity testing was conducted using the Super Mini-Res, manufactured by L&R Instruments, Inc. The in-situ values of ground electrical resistivity were determined using a Wenner array with “a spacings” of 2.5, 5, 10, 20, 30, 40 and 60 ft. Two orthogonally-oriented vertical electrical soundings (VES) were collected around a center point. Comparison of the VES results indicate that readings for the larger “a spacings” were affected by some unknown source of interference. In addition, smaller “a spacing” values were observed that were not typical for the site area. Accordingly, the entire VES was considered suspect. A second set of soundings was performed immediately north of the plant and results were determined to be an accurate representation of site conditions.