


Mapping the Seafloor
The two main techniques used to map the seafloor are bathymetric profiling and side-scan sonar.
 Bathymetric profiling is used to determine water depth and map the elevation of the seafloor. It has been used to map seafloor elevation and water depth prior to construction and dredging activity, map surface expressions of sinkholes, map extents of reefs and map sediment slumps from berm failures. Depending on the target and size of the survey area, the bathymetry data can be collected using either be single beam or multibeam soundings. Single -beam sounders emit a single beam of sound downward from the boat to the seafloor and measure the amount of time it takes for the sound to travel through the water, bounce off the seafloor, and return to the sounder. Multibeam echosounders use hundreds of very narrow adjacent beams arranged in a fan-like swath of typically 90 to 170 degrees across. The result is a wide swath of date with just a single data transect.
")
Side-scan sonar also emits a fan-shaped sonar pulse from the boat down toward the seafloor. The intensity of the acoustic reflections from the seafloor is recorded in a series of cross-track slices to form an image of the seafloor and objects on the seafloor within the swath of the beam. Side-scan sonar is commonly used to locate potential seafloor hazards such as former bridge piles and wrecks, mapping seafloor utilities, evaluating reefs, mapping sea grass and performing grain size surveys. The high resolution images are capable of imaging objects as small as several inches in size.
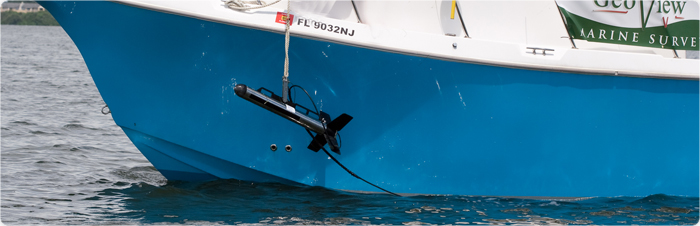
The data from both methods can be corrected for tides and wave action and can be output in most common coordinate systems and vertical datums. The data can be presented in AutoCAD, GIS and/or table formats. With both small and large survey vessels, GeoView has conducted seafloor mapping from small pond and lakes studies to large offshore projects including several projects associated with the expansion of the Panama Canal.

