Geological
Characterization
Objective
As part of an environmental remediation
project was conducted at a chemical
manufacturing and disposal facility in the
eastern United States, GeoView was asked to
determine the depth to limestone bedrock
underlying the project site and identify any
suspected karst features within the upper
portion of the limestone stratum.
Method
The general geological setting across the
project site was an unsaturated surficial
clay stratum underlain by a competent
limestone stratum. From a geophysical
standpoint these two lithologies differ
widely in terms of physical properties. The
p-wave velocity contrast between unsaturated
clay and limestone often varies by a factor
of 5 to 10. The electrical resistivity
contrast between these two materials often
varies by 1 to 2 orders of magnitude.
Because of the large contrast in both
seismic velocity and electrical resistivity,
the geophysical investigation was conducted
using a combination of p-wave seismic
refraction and multi-electrode DC
resistivity floor. Both 2-dimensional and
3-dimensional data was collected at the
site.
Results
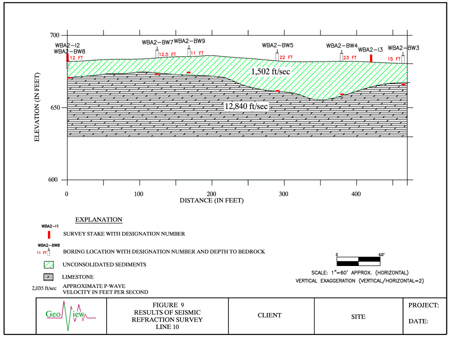
A total of 2,300 ft of Seismic Refraction
data and 4,900 ft of Multi electrode
resistivity data were collected. There was
an excellent correlation between the seismic
determined depth to top of limestone bedrock
and the depth to limestone bedrock
determined from several confirmation borings
performed along the geophysical transect
lines. Typically, the seismic derived depths
correlated the boring determined depths
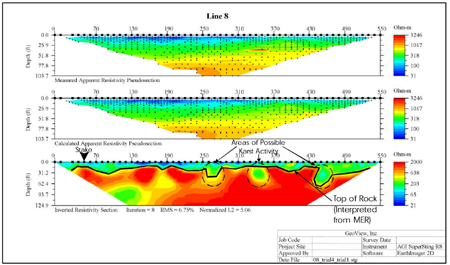
within 2 to 3 ft. Several suspected karst
features were identified on both the seismic
data and the multi electrode resistivity
data.
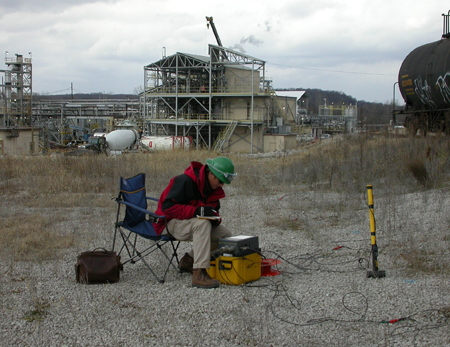
Figure 1 - Collection of Seismic
Refraction Data.
Figure 2 - Seismic Cross Section Showing
Depth to Bedrock and Correlation to Standard Penetration Test Borings.
Figure 3 - Electrical Resistivity Pseudo
Section Showing Suspected Karst Features.
|